Whether it’s hot or cold, stay focused! What’s involved in lens athermalization.
A huge range of commercial-off-the-shelf lenses are readily available from many catalog optics suppliers. However, sometimes what you want is not available and you just need a custom design. One of the features often required in custom lenses is that they operate over a wide temperature range without manual or motorized adjustment. You find such lenses in applications such as lidar, automotive cameras, uncrewed vehicles (aka drones) and, of course, space. This is the field of lens athermalization.
There are three things in a lens that change with temperature:
- The lens barrel expands and contracts.
- The lens elements expand and contract, and change radius of curvature.
- The lens element materials change refractive index.
The first two are well known thermal coefficient of expansion (TCE) factors. The material for the barrel and spacers can be chosen by the designer but by far the most common material is aluminum alloy which has a TCE of about 23.6×10⁻⁶/°C. Brass may be used or even stainless steel but the TCE will not change by more than about a factor of 2. On rare occasions invar might be used which has a TCE of about 1×10⁻⁶/°C.
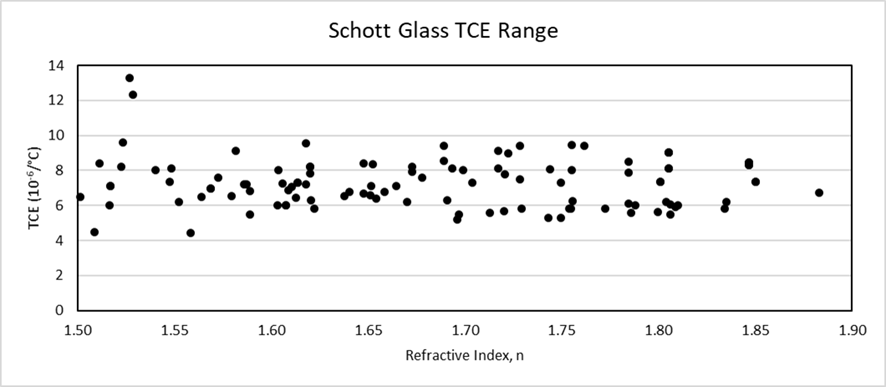
There are many glasses available (from several suppliers) over a refractive index and dispersion range, but the TCE range is quite small, mainly 5-10×10-6/°C, and does not have a trend with refractive index (see the plot of Schott glasses below). Fused silica is an outlier with a TCE of 0.5×10⁻⁶/°C (not on the plot).
One thing that is obvious is TCE values are always positive.
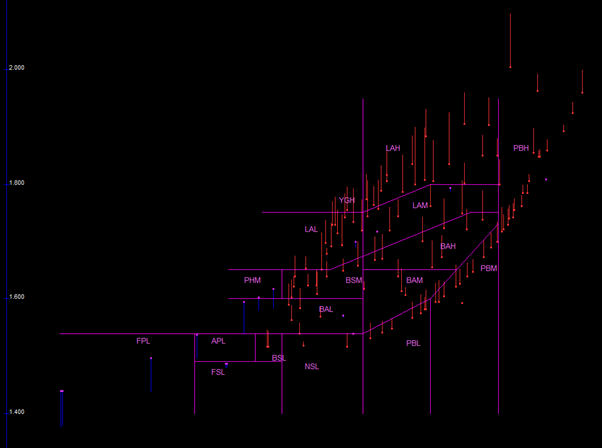
The third on the list is a lesser-known parameter, dn/dT. The refractive index, n, changes with temperature, T, on a scale of parts per million. Glasses don’t have the same dn/dT so it’s important that the designer has a good knowledge of the dn/dT of the many glasses. You don’t see many plots of dn/dT across a range of glasses, so I’d like to give a shout out to OSD Optics and their Synopsis software which provides a glass map with dn/dT indicators. Below is a plot for Ohara glass. Normally a glass map is presented as the refractive index on the y axis versus Abbe number (dispersion) on the x axis, and what you see is just a set of dots, one for each glass. Here you can see lines on each dot which show the dn/dT. The red lines show positive dn/dT (with the length of the line proportional to the value) and blue lines show negative dn/dT.
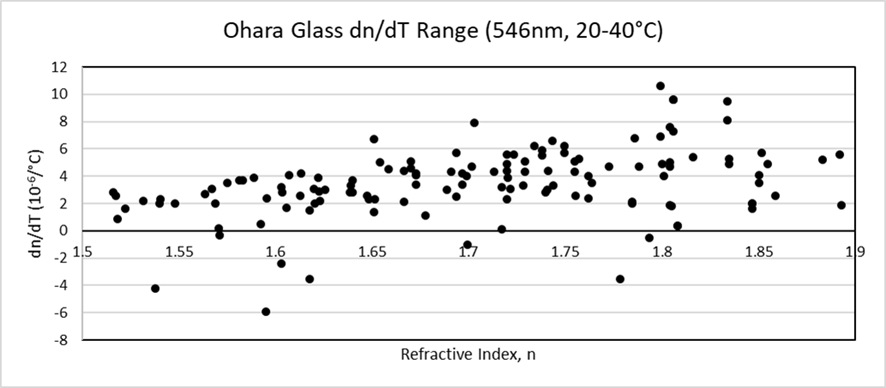
If we plot the data as dn/dT v refractive index, we see that most values are from -6 to +10 x10-6/°C. The vast majority of glasses have a positive dn/dT but there are a few with extremely low or negative dn/dT. These glasses are useful for athermalization.
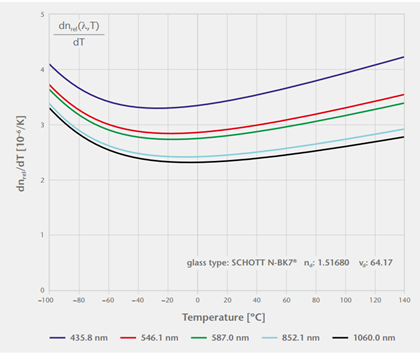
Strictly speaking dn/dT is not a single value. It depends on both temperature and wavelength as this plot below from a Schott catalog of N-BK7 shows.
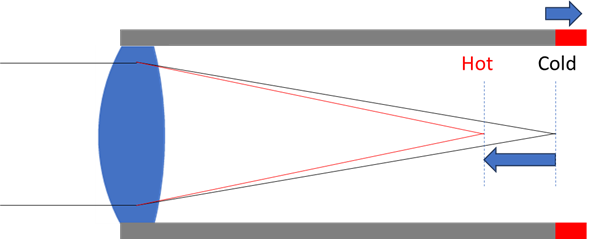
A positive dn/dT means that the refractive index increases with temperature which means the lens focal length reduces as shown below. This is unfortunate because the lens barrel (with a positive TCE) will get longer sending the camera sensor further away.
Let’s look at a real example. Consider this lens which is a pretty standard double Gauss with 10° field of view.
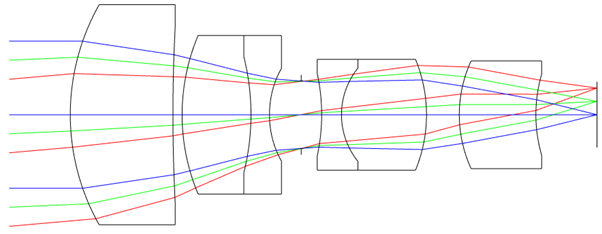
I optimized this lens only for operation at a nominal 20°C. I then analyzed the performance over +/-50°C (ie -30°C to +70°C). The barrel and spacers were assumed to be aluminum. Fortunately, most design software like Zemax and Code V adjust glass refractive index and dimensions of glass and metal automatically for the temperature range.
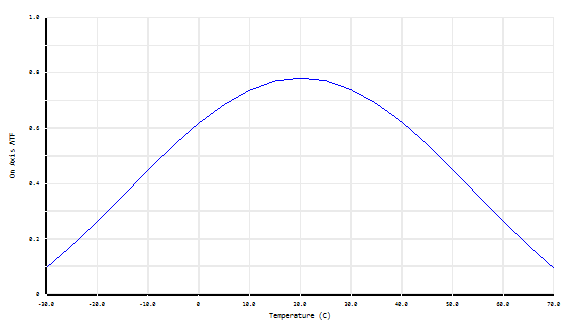
What we find is, the on-axis performance is good at 20°C but is terrible at extreme temperatures. The plot below shows the on-axis MTF over the temperature range. The reason for the drop in performance is almost entirely a temperature-induced focus error.
Analysis shows that the focus correction required at extremes of temperature is +/-18µm. At +70°C we need to bring the image plane left (closer to the lens elements) by 18µm.
With modern optical design software we can perform some what ifs. What would the error be if the glass had zero TCE or zero dn/dT etc? We can repeat the above analysis using artificial glasses with fictitious thermal properties. For this lens the table below summarizes the results.
| Parameter Variation | Focus Shift |
| All parameters | +/-18µm |
| Only glass dn/dT | +/-11µm |
| Only housing TCE | +/-8µm |
| Only glass TCE | +/-4µm |
What we can see is that the glass TCE alone has a small effect on focus error (+/-4µm). The dn/dT has about 3x higher effect on defocus. Its contribution is about 60% of the total and the housing/spacers contribute 40%. All contributions are in the same direction.
To compensate for this focus error and thus design an athermalized lens our only lever is choosing glasses with appropriate dn/dT. This means we need to introduce some lower or negative dn/dT glass into the design. Without going into details of which glasses might be selected we can see the improvements in thermal performance with a series of iterations to the design.
These plots below show a process of intelligent manual glass selection followed by an optimization at each stage. The right-hand plots show the MTF v temperature with each design’s focus error. The final iteration achieves sub-micron focus error and a very uniform MTF. The layouts look indistinguishable to the eye. This is because for each iteration the swapped glasses were similar in other properties.
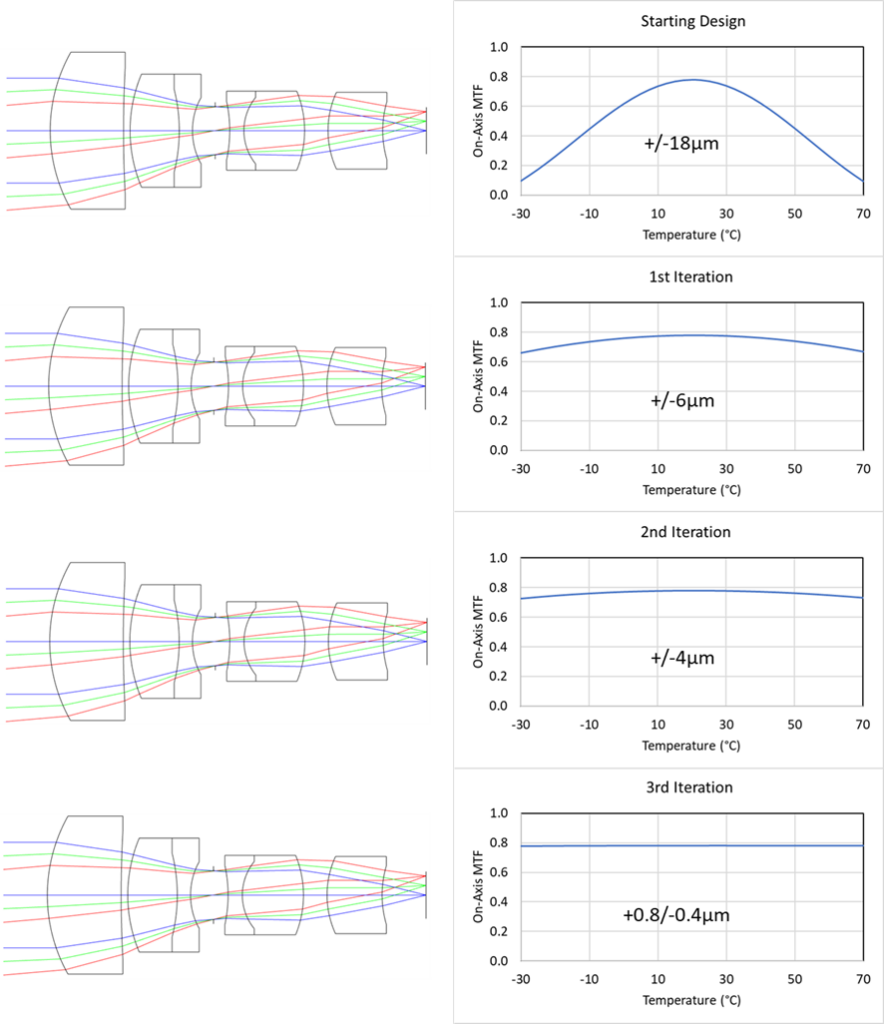
There are other tips and trick to consider but this shows in principle how we can athermalize a lens.
In summary, the key to athermalization is choosing glasses with the most appropriate dn/dT. Other parameters are secondary.